
Is the Grass Greener for U.S. Large Stocks?

If there were a contest for the most frequent of Frequently Asked Questions we’ve been hearing lately, this one would be the easy winner: “Why is my globally diversified portfolio underperforming a simple allocation to the S&P 500 Index?”
We’ve covered the details on why this has been so in the recent past in our post: “Staying on Course in Turbulent Markets.” Basically, while U.S. large stocks have been enjoying their days in the sun (winter blizzards aside), other markets have been lying lower lately, especially international, emerging market and small-cap stocks.
The near-term contrast has been generating “grass is greener” envy among investors with diversified portfolios.
But let’s remember why we’re diversified to begin with. As Nobel Laureate Eugene Fama has counseled: “Pick your risk exposure, and then diversify the hell out of it.” Our own recent post and an abundance of other coverage have echoed similar sentiments at greater length. To cite a few:
This Investment News piece, “When underperforming the S&P 500 is a good thing,” may require a free subscription to access it, but it’s worth reading as well to gain perspective on recent returns.
Personal finance columnist Tim Maurer also offers good insights in his piece, “The Disciplined Investor’s Worst Enemy.”
In “How to Create an International Investing Strategy” from U.S. News and World Report, the author reminds us about the importance of adopting a long-term outlook.
While 2014 happened to be a good year for a concentrated bet in the U.S., other asset classes’ days will come. Here is one of my favorite pictures that says at least 1,000 words on the subject. BlackRock’s version is officially entitled, “The Periodic Table of Returns” (reminiscent of your high school science class). Many of us in the biz call it “the crazy quilt chart”:
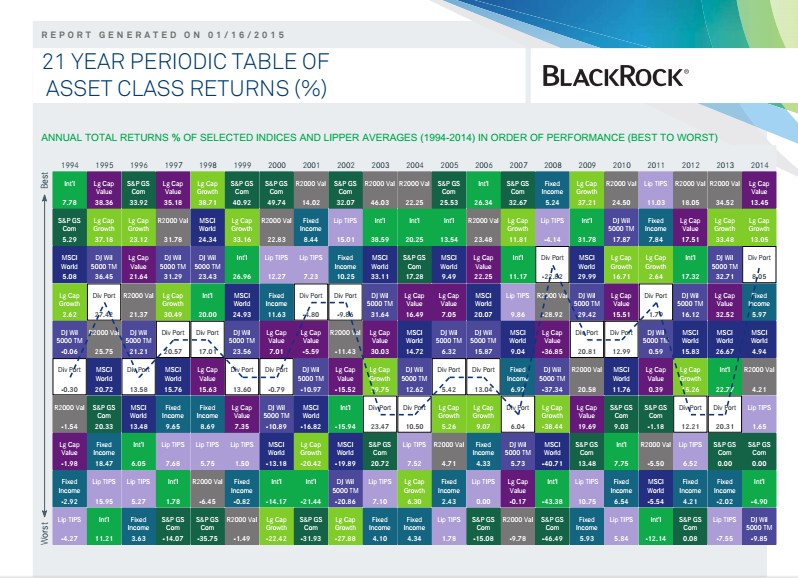
What you’re seeing here is a visual representation of how various investment asset classes stacked up each year (each column), including how a “typical” diversified portfolio performed (if there is such a thing as a typical portfolio; i.e., DON’T assume yours is the same). By adding color to the various performances, it becomes crystal clear that:
Trying to guess which asset class is going to be the big star or grand flop next year based on prior years’ performances is anybody’s wild guess. And yes, that includes the recent winners. That’s where the crazy part comes in.
With a diversified portfolio performance hovering relatively close to mid-range over the years, Professor Fama’s “diversify like hell” strategy appears to have offered more dependable long-term performance than chasing any one asset class.
We get why someone would want to act on a perceived opportunity for lusher returns. After all, we humans are hardwired for fight or flight from eons of evolution. But if you remain tempted to abandon diversification in pursuit of last year’s greener grass, just remember the crazy quilt chart, and consider tending to the choking weeds of excess trading expenses instead.

What Should You Do When Your Investments Are Head-To-Head With Recession Volatility?
Use this simple flowchart to help you determine what (if anything) you should do to help protect your investments. Download your FREE copy now to discover:
How to assess your current investment situation whether you're 10 years away, 5 years away, or already in retirement
The 3 or 4 critical questions you need to ask yourself that will determine what you should do next (if anything)
Your level of confidence with your current investment strategy and what you can do about it